
Visual Comparison of Multi-label Classification Results
In the proceedings of Vision, Modeling, and Visualization, 2021
Abstract:
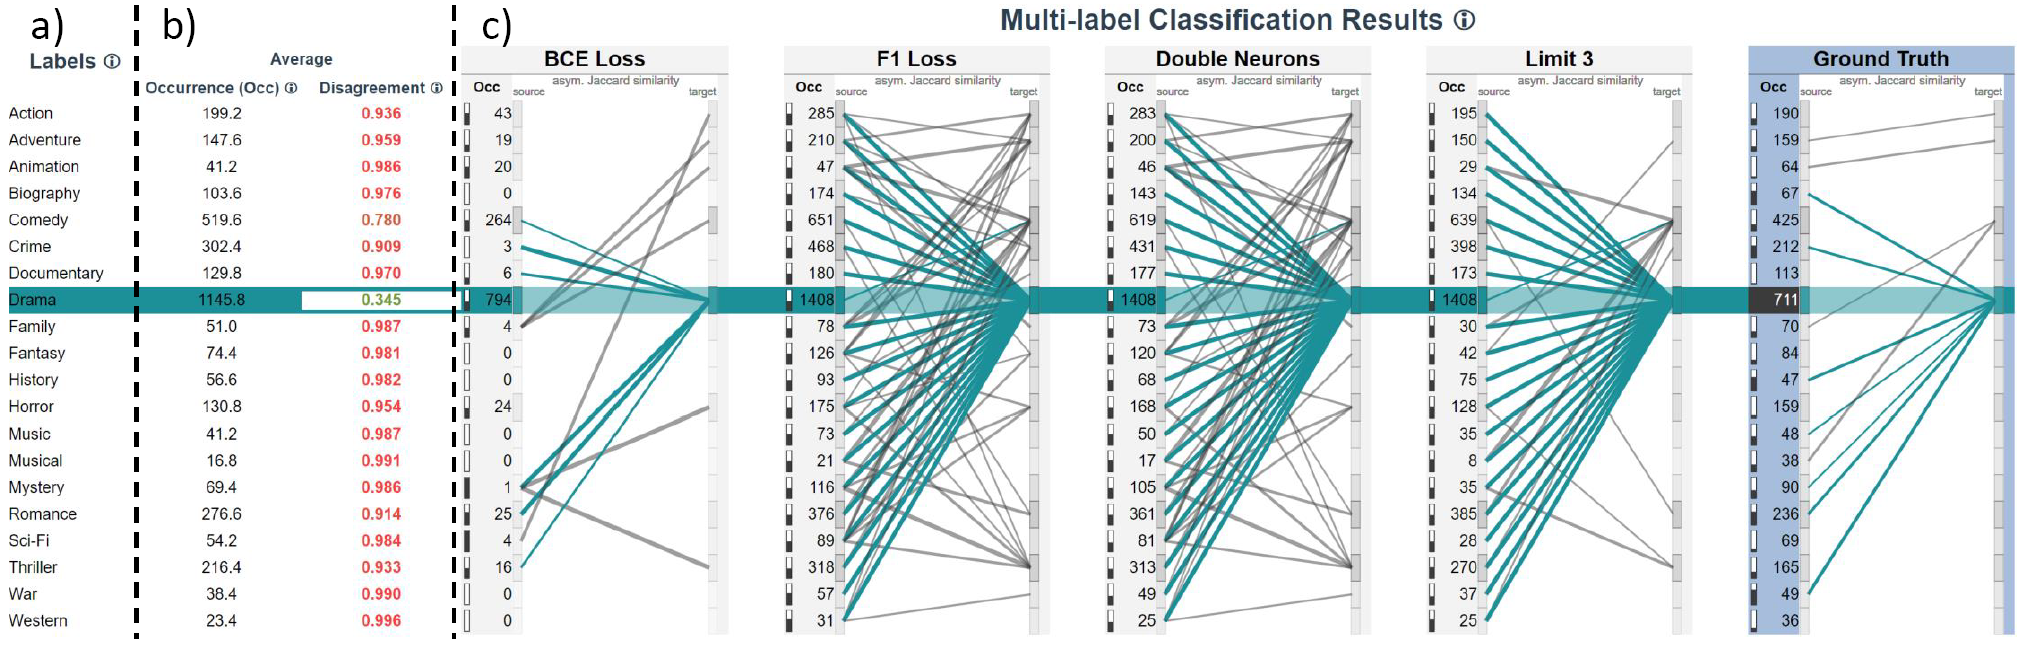
In multi-label classification, we do not only want to analyze individual data items but also the relationships between the assigned labels. Employing different sources and algorithms, the label assignments differ. We need to understand these differences to identify shared and conflicting assignments. We propose a visualization technique that addresses these challenges. In graphs, we present the labels for any classification result as nodes and the pairwise overlaps of labels as links between them. These graphs are juxtaposed for the different results and can be diffed graphically. Clustering techniques are used to further analyze similarities between labels or classification results, respectively. We demonstrate our prototype in two application examples from the machine learning domain.
PDF Demo DOI
To cite: Cedric Krause, Shivam Agarwal, Mohammad Ghoniem, Fabian Beck, "Visual Comparison of Multi-label Classification Results" In the proceedings of Vision, Modeling, and Visualization, 2021. doi:10.2312/vmv.20211367
BibTeX:
@inproceedings{Krause2021Visual,
author = {Krause, Cedric and Agarwal, Shivam and Ghoniem, Mohammad and Beck, Fabian},
title = {Visual Comparison of Multi-label Classification Results},
booktitle = {Vision, Modeling, and Visualization},
doi = {doi:10.2312/vmv.20211367},
year = {2021},
abstract = {In multi-label classification, we do not only want to analyze individual data items but also the relationships between the assigned labels. Employing different sources and algorithms, the label assignments differ. We need to understand these differences to identify shared and conflicting assignments. We propose a visualization technique that addresses these challenges. In graphs, we present the labels for any classification result as nodes and the pairwise overlaps of labels as links between them. These graphs are juxtaposed for the different results and can be diffed graphically. Clustering techniques are used to further analyze similarities between labels or classification results, respectively. We demonstrate our prototype in two application examples from the machine learning domain.}
}